You manage facilities and buildings and want to measure and control the electricity costs for a single building or a collection of buildings using a unified platform.
SimplMeter Advanced Monitoring
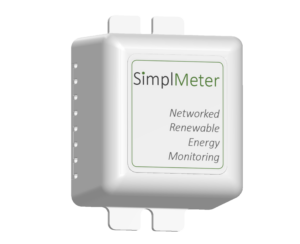
SimplMeter is a real-time energy and power measurement device for electricity. It is available in single or dual-channel versions. The dual channel version is used to measure building consumption along with overall energy generation (e.g. solar) capacity of a building in real-time. SimplMeter is a decision-making tool for optimizing energy consumption and minimizing electricity expenses while at the same time presenting a real-time picture of the pattern of energy consumption and energy generation.
- One or two revenue-grade power measurement elements
- Programmable tariff structure converts kWh and kW to dollars
- Calculates demand charge savings in real-time
- 4G or Wi-Fi Connectivity
- Real-time and accumulative energy and money graphs
Introducing SimplMeter
SimplMeter: 7 Advantages
Installing SimplMeter
Energy Data in Dollars
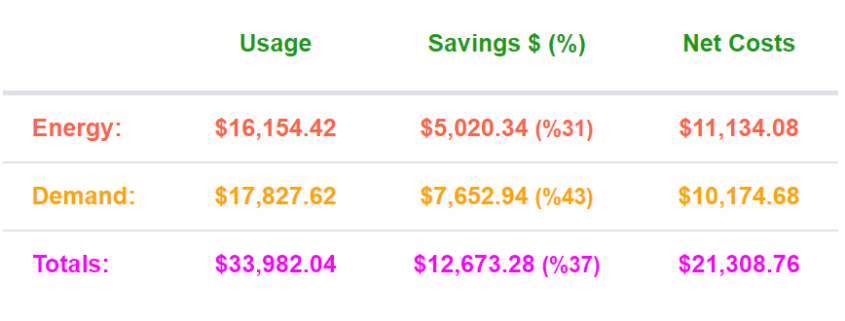
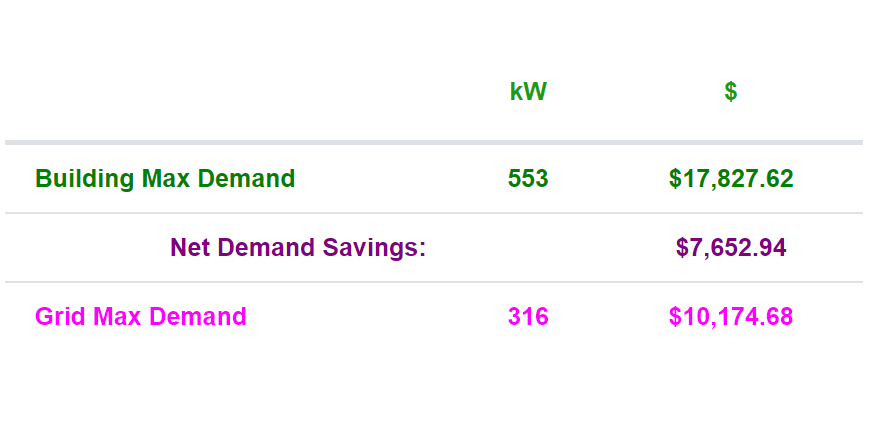
Demand and energy costs and savings for any date range are viewed in a simple, high-level table.
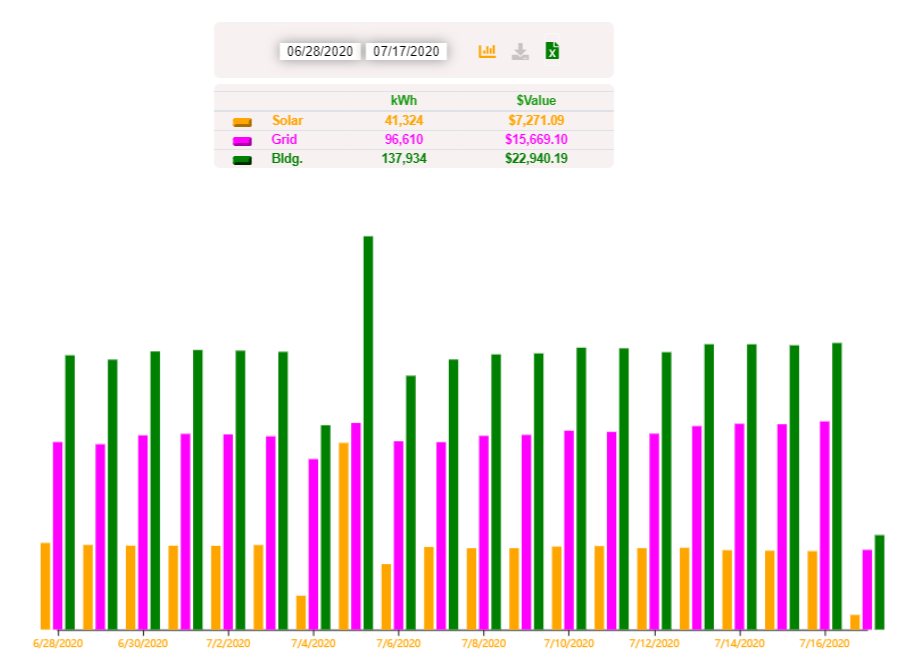
Energy costs and savings are presented in daily format and may be downloaded for further analysis.
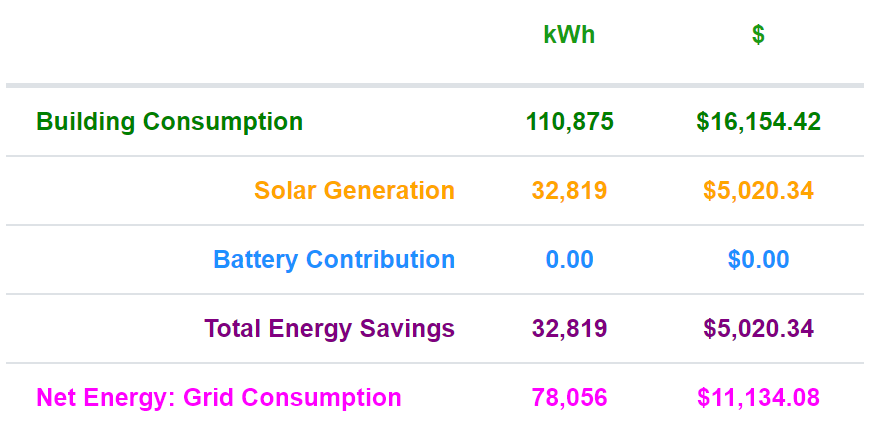
For energy, the contributions of grid power, solar energy generated and batteries in the system are measured and reported for any data range.
Demand costs and savings are reported for any specified data range.
Observe in Real Time
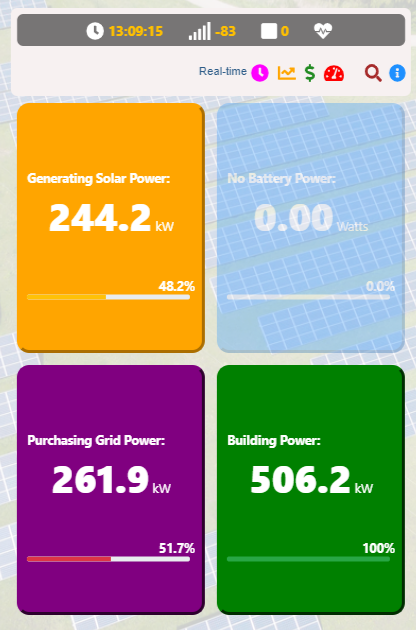
Observing the real-time signature of electricity consumption or energy generation of a building through simple numbers is one of the key methods of solving tactical energy problems. Simpl dashboard provides a real-time view of a buildings consumption, solar generation, battery contribution and the grid power draw.
A real-time chart is also available to observe the most recent 10 to 2000 points on the time axis.
Strategic Analysis
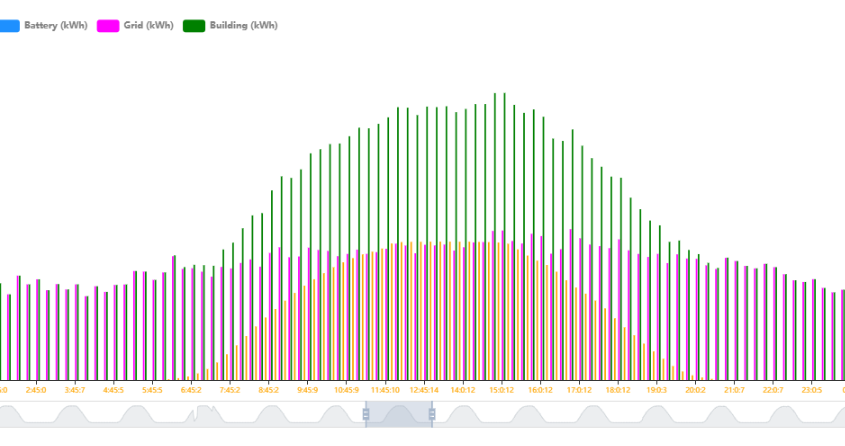
To perform strategic analysis on money-savings opportunities, 15-min interval data is often used to understand the energy signature of a building. With SimplMeter, 15-min interval information may be downloaded and charted as shown below. This chart shows the energy values for a building, grid energy and solar. Systems that are equipped with energy storage, will also see the contribution of the energy storage portion of the system.
The presentation of energy and demand information in terms of dollars is clearly a critical aspect of the strategic analysis.
Technician’s View
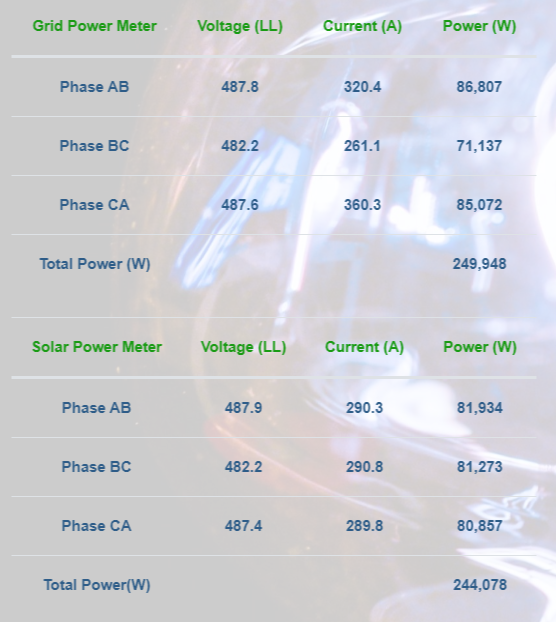
The technician’s view allows the opportunity to take a look at voltages, currents and power levels for each individual phase both for solar and grid meters. This is a root-cause analysis tool for the installer and the building maintenance technicians.
System Management and Administration
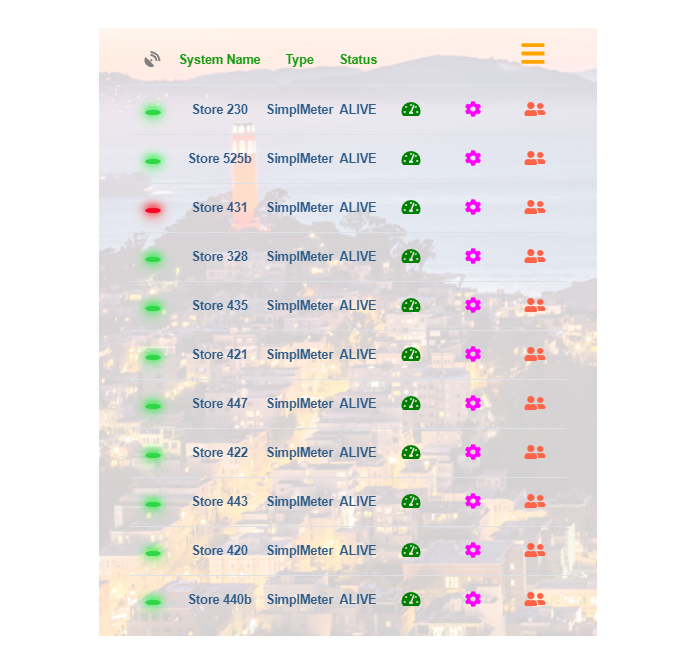
Get a quick view of all your systems and an overview of their status in one screen.
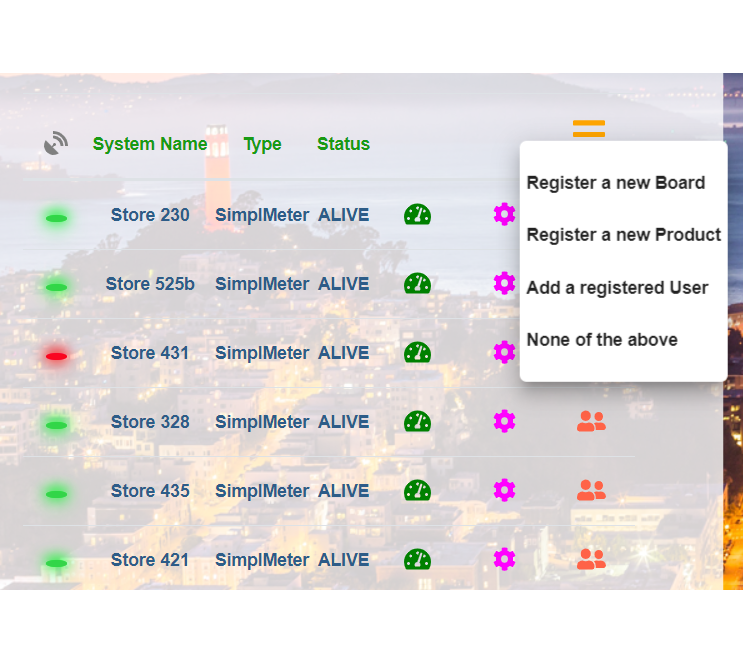
Commissioning a new system or a new user for the system is as easy as clicking the menu button.
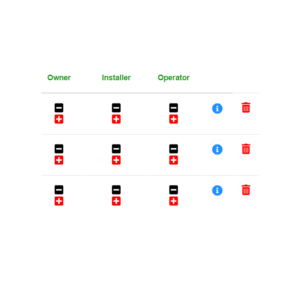
Users are added as Installers, Operators and Owners. Each category has special privileges and access.


